Monday, November 03, 2008

Presidential Election 2008 - McCain v/s Obama - Final

Without further ado, here are my final predictions from a statistical simulation model to predict the outcome of the 2008 presidential election. As before, the model accounts for the fact that the reported voter preferences are only one of many likely scenarios because of the statistical margin of error inherent in all polls. Using Monte Carlo simulation, I can generate many such scenarios, and tally the results to predict the range of likely outcomes and the probability of various outcomes.

For this simulation, I used the latest Real Clear Politics poll averages of 15 battleground states - AZ, CO, FL, GA, IN, MO, MT, NV, NM, NC, OH, PA, SD, VA, and WV. See my previous post from October 30th for details about the model and its assumptions after the results.

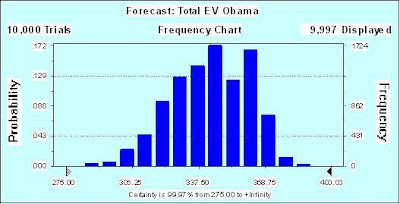
RESULTS (from 10,000 simulations):

  • Average number (mean) of Obama electoral votes => 333
  • Standard deviation => 21.3
  • Range corresponding to 68% probability => 354 - 312 EV
  • Probability of Obama win => 99.85%
  • Best case / worst case scenario => 393 - 257 EV
  • States with the greatest impact on likely outcomes => FL (51%), OH (21%), NC (11%), VA (5%), MO (5%)


Until tomorrow evening, when truth awaits .....
Tuesday, October 28, 2008

Presidential Election 2008 - McCain v/s Obama - Rev 1

Here is the latest update of results from a statistical simulation model to predict the outcome of the 2008 presidential election. The model accounts for the fact that the reported voter preferences are only one of many likely scenarios because of the statistical margin of error inherent in all polls. Using Monte Carlo simulation, I can generate many such scenarios, and tally the results to predict the range of likely outcomes and the probability of various outcomes.

For this simulation, I used the latest Real Clear Politics poll averages of 14 battleground states - AZ, CO, FL, GA, IN, MO, MT, NV, NH, NM, NC, OH, VA, and WV. Scroll down for details about the model and its assumptions after the results.

RESULTS (from 10,000 simulations):

  • Most likely number of Obama electoral votes => 364
  • Probability of Obama win => 99.99%
  • Best case / worst case scenario => 393 / 269 EV
  • States with the greatest impact on likely outcomes => FL (57%), NC (18%), MO (10%), IN (9%)


For the inquiring mind, here are the key features / assumptions in my model.
  1. On a state-by-state basis, undecided voters are allocated 60% to McCain and 40% Obama.
  2. For each simulation, the likely percentage of Obama votes is calculated by assuming it follows a normal distribution with (a) mean based on the poll results plus undecided allocation and (b) standard deviation based on sample size. I use an avereage sample size based on all the polls used for the RCP average.
  3. The winner for each state is allocated all of the state's electoral votes (with the exception of Nebraska, where the winner of popular votes gets 3 delegates and the loser gets 2 delegates).
  4. The results are aggregated for 10,000 simulations to calculate: (a) most likely number of electoral votes for Obama (the "mode"), and (b) probability of Obama winning more than 270 electoral votes.
  5. States with the greatest impact on likely outcomes are ranked based on their fractional contribution to the variance in Obama EV predictions.
One more update forthcoming next week just before election day. Stay tuned.

Thursday, March 06, 2008

Presidential Election 2008 - McCain v/s Obama - Rev 0

This is the first in a series of posts that will present results from a statistical simulation model to predict the outcome of the 2008 presidential election. Although the Democratic party's nominee has not yet been chosen, I am using Senator Obama as a placeholder since he is the current leader in delegate count. The data for state-by-state voter preferences in a race between Senator McCain and Senator Obama are taken from the Survey USA poll of March 06, 2008.

As in my previous work during the 2004 election cycle (see earlier posts in this blog),
I use a statistical simulation model to account for the uncertainty inherent in polls with small sample sizes (with ~400-500 samples in most cases). Because of the statistical margin of error inherent in all polls, the reported voter preferences are only one of many likely scenarios. Using Monte Carlo simulation, I can generate many such scenarios, and tally the results to predict the range of likely outcomes as well as the probability of each outcome.

Here are the key features / assumptions in my model.

  1. On a state-by-state basis, undecided voters are allocated equally between McCain and Obama.
  2. For each simulation, the likely percentage of Obama votes is calculated by assuming it follows a normal distribution with (a) mean based on the poll results plus undecided allocation and (b) standard deviation based on the polling error. I am assuming the polling error to be 4% based on data from the 2004 election - as SUSA does not provide this information.
  3. The winner for each state is allocated all of the state's electoral votes (with the exception of Nebraska, where the winner of popular votes gets 3 delegates and the loser gets 2 delegates).
  4. The results are aggregated for 5000 simulations to calculate: (a) average number of electoral votes for Obama, and (b) probability of Obama winning more than 270 electoral votes.
  5. Clarification - The mean of the distribution of Obama electoral votes is different from the "best guess" electoral vote total obtained by adding the state-by-state totals calculated from the mean estimate of voter preferences + undecided allocation. The "best guess" number is also the result reported by SUSA, and does not take into account the impact of sampling error in the polls.
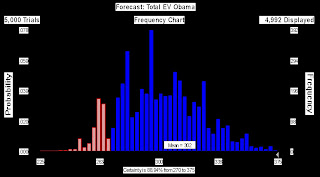
RESULTS - If the elections were held today, there is an 89% chance that Senator Obama will be elected. The mean (average value) of the distribution of electoral college votes for Obama is 302, and the mode (most likely value) of this distribution is 295.

Note that these are different from the SUSA "best guess" number of 280, primarily because the difference between voter preferences for Obama and McCain in such key states as Texas and Florida is smaller than the assumed sampling error of 4%. In other words, there is a non-negligible probability that these states could go for Obama rather than McCain, thus increasing the mean and most likely electoral vote count for Obama.


Scroll down for a graph showing the projected distribution of Obama's electoral votes, with the blue bars denoting the outcomes corresponding to a Obama victory.


Clearly, this is very early in the election cycle, and much will change between now and November. Needless to say, the usual caveats about using pre-election polls for predictive purposes with a healthy dose of skepticism apply here as well. I will keep updating these results as more and more state-by-state voter preference polls become available. Hopefully, the results will become more stable as election day approaches.

Until then, 10-4.

Back from Hibernation

Hello y'all!

My last post was some 3 1/2 years ago - the day before the 2004 presidential elections. Needless to say, I got burnt by my assumption that undecided voters would go for Kerry by a 2:1 margin. Before going to press, I had run a simulation where the undecided vote was equally split - with the result that Bush was going to win with a 279-261 margin. Hindsight being 20:20, I wish I had picked this scenario as my "most likely prediction". C'est la vie.

Here we are in 2008, with yet another presidential election upon us. As we wait for the Democratic party's nomination process to sort itself out, Survey USA has come out with a 50-state poll pitting McCain against Obama as well as McCain against Clinton. In the next days and months, I will be updating my model for the 2008 elections beginning with the SUSA polling data.

Until then, 10-4.

Monday, November 01, 2004

Presidential Election - Final Prediction


Over the last fortnight, I have been discussing the results from a simulation model to predict the outcome of the presidential election. The moment of truth is upon us, and without further ado, let me begin with a summary of my final prediction:

  • "Best Guess" electoral college votes for Kerry => 286
  • Probability of Kerry win (>270 electoral votes) => 65.64%
Key battle-ground state victories predicted for Kerry are - FL, PA, MN, WI and IA (plus HI, ME, MI, NH, NJ, OR and WA). Safe Kerry states are - CA, CT, DE, IL, MD, MA, NY, RI, VT and DC.

Key battleground state victories predicted for Bush are - OH, NM and NV (plus AR, CO, MO and WV). Safe Bush states are - AL, AK, AZ, GA, ID, IN, KS, KT, LA, MS, MT, NC, NE, ND, OK, SC, SD, TN, TX, UT, VA, WY.

I use a simulation model to account for the uncertainty inherent in polls with small sample sizes (with ~1000 samples in most cases). Because of the statistical margin of error in all polls, the reported voter preferences are only one of many likely scenarios. Using statistical simulation methods, I can generate many such scenarios, and tally the results to predict the range of likely outcomes as well as the probability of each outcome.


Here are some of the key features / assumptions in my model.

  1. For the 18 battleground states, I use the average of polls over the last week or so as reported by Real Clear Politics. For the other states, where the lead of the candidate is beyond the sampling margin of error, I use the latest poll data from 2.004.com. I believe using average poll numbers for the battleground states makes the analysis more robust.
  2. On a state-by-state basis, undecided voters (after considering Nader votes) are allocated between Bush and Kerry based on one of three scenarios: (a) equal spilt between Bush and Kerry, (b) favor Kerry 3:2, and (c) favor Kerry 2:1.
    • The incumbent rule suggests that undecided voters tend to break for the challenger in roughly 2:1 proportions.
    • However, this might be mitigated by the natural tendency to stay the course when national security is a prime concern.
    • On the other hand, the polls may not have correctly accounted for the preferences of first-time (especially) young voters. There is some evidence that this group tends to favor Kerry.
    • There is also the issue of increased turnout, which is likely to favor Kerry.
    • In my judgement, the net effect of all these factors will be a tip towards Kerry of undecided voters, i.e., a 2:1 bias in favor of Kerry. This is higher than what I have been using before - primarily because of the turnout factor.
  3. The likely percentage of Kerry votes is calculated by assuming it follows a normal distribution with (a) mean based on the poll results plus undecided allocation and (b) standard deviation based on the polling error.
  4. The winner for each state is allocated all of the state's electoral votes.
  5. The results are aggregated for 5000 simulations to provide the average electoral votes for Kerry and also the probability of Kerry winning more than 270 electoral votes.
  6. The "best guess" electoral vote total is obtained by adding the state-by-state totals calculated from the mean estimate of voter preferences + undecided allocation. Note that this is different from the mean of the distribution of Kerry electoral votes.
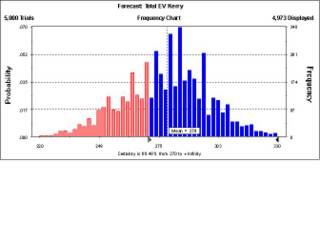
Scroll down for a graph showing the projected distribution of Kerry's electoral votes for the scenario where undecided voters favor Kerry 2:1. The blue bars denote the outcomes corresponding to a Kerry victory. As noted earlier, I am going with this scenario as my final "bottom-line" prediction.

En passant, thanks to Andrea Moro and Sam Wang for generating the media's interest in probabilistic predictive models for this Presidential Election.

Tomorrow, if all goes well, we shall be able to determine the predictive accuracy of this and other models of the presidential election. Stay tuned for the post-mortem.

Until then, 10-4.


Distribution of Kerry electoral votes - Final Prediction Posted by Hello

Friday, October 29, 2004

Presidential Election - Update 3


I am continuing to use the average of polls for the 18 battleground states from the last week or so as reported by RealClear Politics. I believe this makes the analysis more robust than relying on just the latest poll results.

Here is the latest update to my simulation-based predictions of the presidential election outcome using data as of 12:05 AM, October 29.


SCENARIOKerry electoral votesKerry win probability
Undecided voters split between
Kerry and Bush
25929.03
Undecided voters favor Kerry 3:227559.16
Undecided voters favor Kerry 2:1286
77.58


Scroll down for a graph showing the projected distribution of Kerry's electoral votes for the scenario where undecided voters favor Kerry 3:2. The blue bars denote the outcomes corresponding to a Kerry victory. As in my previous post, I am going with this scenario as my "bottom-line" prediction.

Details of the model and other assumptions can be found in my Oct 21 post titled "Presidential Election" - accessible from the "Previous Posts" menu on the right.

I will update this table with my final prediction on Monday (11/01).

Until then, 10-4.


Distribution of Kerry electoral votes - Update 3 Posted by Hello

Wednesday, October 27, 2004

Presidential Election - Update 2


I have made one modification to my model. Instead of using the latest poll results for the 18 battleground states, I now use the average of polls from the last week or so as reported by RealClear Politics. Hopefully, this makes the analysis more robust.

One other caveat - I have excluded the CNN/USAT/Gallup poll from 10/21-24 for Florida as it appears to be an outlier. They show Bush+8, while the other polls show Bush+1.2, Bush+4, Kerry+3, Tie, Kerry+2, Tie.

Here is the latest update to my simulation-based predictions of the presidential election outcome using data as of 11:55 AM, October 27.


SCENARIOKerry electoral votesKerry win probability
Undecided voters split between
Kerry and Bush
26135.08
Undecided voters favor Kerry 3:227866.16
Undecided voters favor Kerry 2:1290
81.84


Scroll down for a graph showing the projected distribution of Kerry's electoral votes for the scenario where undecided voters favor Kerry 3:2. The blue bars denote the outcomes corresponding to a Kerry victory. As in my previous post, I am going with this scenario as my "bottom-line" prediction.

Details of the model and other assumptions can be found in my Oct 21 post titled "Presidential Elections" - accessible from the "Previous Posts" menu on the right.

I will update this table on Friday (10/29) and finally on Monday (11/01).

Until then, 10-4.


Distribution of Kerry electoral votes - Update 2 Posted by Hello

Monday, October 25, 2004

Presidential Election - Update 1


In my last post, I presented assumptions behind a simulation-based model for predicting the outcome of the presidential election and some preliminary results. Here is the update using data as of 11:07 AM, October 25:


SCENARIOKerry electoral votesKerry win probability
Undecided voters split between
Kerry and Bush
26035.72
Undecided voters favor Kerry 3:227966.48
Undecided voters favor Kerry 2:129285.52


Scroll down for a graph showing the projected distribution of Kerry's electoral votes for the scenario where undecided voters favor Kerry 3:2. The blue bars denote the outcomes corresponding to a Kerry victory. I am going with this scenario as my "bottom-line" prediction.

For the detail-oriented, here is a link that provides an analysis of past elections suggesting that undecided voters tend to favor the challenger .

I will keep updating the table and the figures on a daily basis, time permitting.

Until then, 10-4.


Distribution of Kerry electoral votes - Update 1 Posted by Hello