Presidential Election - Update 3
I am continuing to use the average of polls for the 18 battleground states from the last week or so as reported by RealClear Politics. I believe this makes the analysis more robust than relying on just the latest poll results.
Here is the latest update to my simulation-based predictions of the presidential election outcome using data as of 12:05 AM, October 29.
SCENARIO Kerry electoral votes Kerry win probability Undecided voters split between
Kerry and Bush259 29.03
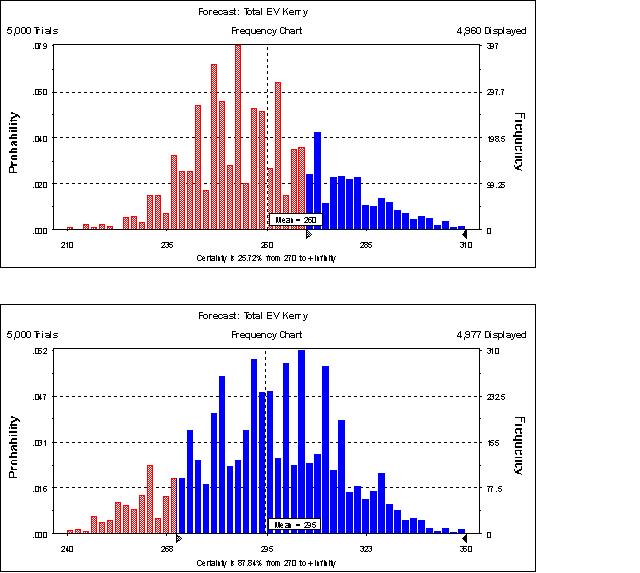
Undecided voters favor Kerry 3:2 275 59.16 Undecided voters favor Kerry 2:1 286
77.58
Scroll down for a graph showing the projected distribution of Kerry's electoral votes for the scenario where undecided voters favor Kerry 3:2. The blue bars denote the outcomes corresponding to a Kerry victory. As in my previous post, I am going with this scenario as my "bottom-line" prediction.
Details of the model and other assumptions can be found in my Oct 21 post titled "Presidential Election" - accessible from the "Previous Posts" menu on the right.
I will update this table with my final prediction on Monday (11/01).
Until then, 10-4.
posted by risk_analyst @ 12:25 PM
0 comments
![]()